Below is a slide from a research group at Berkley.
*1. Based on FLYING OFF COURSE: Environmental Impacts of America's Airports, report by the Natural Resources Defense Council.
- "In nonattainment areas with large airport facilities, commercial aircraft emissions represent a growing percentage of the regional area source inventories as other sources decrease due to implemented controls. In each of the ten cities, commercial jet aircraft are a larger percentage of the inventory in 2010 than in 1990. Even in regions such as Los Angeles and New York, where aircraft are less than the 5 percent of the total mobile source emissions, the percent contribution of aircraft to regional NOx more than doubles by 2010." - EPA study
|
US EPA 1999 STUDY-
Projected growth in commercial aircraft & emissions factors at Metro New York Airports (EWR, LGA, JFK) |
|||
| (short tons/year) Variable Mixing Height | 1990 | 2010 | % increase |
| Increase in landing Takeoffs (LTO) | 383,206 | 452,950 | 18% |
| Volatile Organic Compounds | 3,025 | 4,839 | 60% |
| Carbon Monoxide | 8,712 | 12,808 | 47% |
| Nitrogen Dioxide | 270 | 364 | 35% |
- 1990-2010 Newark (EWR): 1990 2010 Increase
Landing & Take Offs (LTOs) 134,124 183,381 37%
Volatile Organic Compounds 766 1,367 75%
Carbon Monoxide 2,210 3,603 63%
Oxides of Nitrogen 1,554 2,983 92%
Sulfur Dioxide 78 118 51%
- 1990-2010 —LaGuadia (LGA) 1990 2010 Increase
Landing & Take Offs (LTOs) 154,700 158,209 2%
Volatile Organic Compounds 867 1,788 106%
Carbon Monoxide 2,446 3,681 50%
Oxides of Nitrogen 1,644 2,840 73%
Sulfur Dioxide 87 103 18%
- 1990-2010 Kennedy (JFK) 1990 2010 Increase
Landing & Take Offs (LTOs) 94,382 111,360 18%
Volatile Organic Compounds 1,392 1,683 21%
Carbon Monoxide 4,057 5,523 36%
Oxides of Nitrogen 2,531 3,750 48%
Sulfur Dioxide 105 143 36%
- "Airport air pollution is similar in scope to that generated by local power plants, incinerators, and refineries, yet is exempt from many of the rules other industrial polluters must follow. For example, one 747 arriving and departing from an airport in New York City produces as much smog as a car driven over 5,600 miles, and as much polluting nitrogen oxides as a car driven nearly 26,500 miles. While the government has effectively required cars to undergo emissions inspections (with resulting improvements in emissions and efficiency), airplanes have not received the same scrutiny. Meanwhile, air travel is increasing in popularity twice as fast as car travel and is projected to double within the next 20 years."
- congressional testimony presented by Crowley in 2001
|
NASA Fact Book on Aviation Emissions:
A jet engine is an internal combustion engine, just like an automobile engine is. In a jet engine, the fuel and an oxidizer combust (or burn) and the products of that combustion are exhausted through a narrow opening at high speed. Modern jet engine fuel is primarily kerosene, the same fuel used to heat homes in portions of the U.S. Kerosene, a flammable hydrocarbon oil, is a fossil fuel. Burning fossil fuels primarily produces carbon dioxide (CO2) and water vapor (H2O). Other major emissions are nitric oxide (NO) and nitrogen oxide (NO2), which together are called NOx, sulfur oxides (SO2), and soot.-NASA's Glenn Research Center |
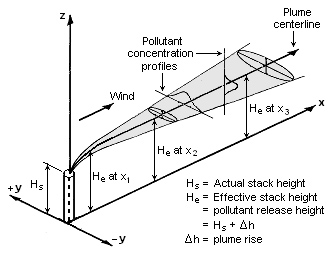
This is a diagram of emissions from a stack burning fossil fuels. Not unlike the emissions released by jet engines, pollutants are dispersed at different atmosphereic levels according to altitude.
As published in the Environmental Protection Agency:
Emissions Factors & AP 42
An emissions factor is a representative value that attempts to relate the quantity of a pollutant released to the atmosphere with an activity associated with the release of that pollutant. These factors are usually expressed as the weight of pollutant divided by a unit weight, volume, distance, or duration of the activity emitting the pollutant (e.g., kilograms of particulate emitted per megagram of coal burned). Such factors facilitate estimation of emissions from various sources of air pollution. In most cases, these factors are simply averages of all available data of acceptable quality, and are generally assumed to be representative of long-term averages for all facilities in the source category (i.e., a population average).
The general equation for emissions estimation is:
E = A x EF x (1-ER/100)
where:
• E = emissions;
• A = activity rate;
• EF = emission factor, and
• ER =overall emission reduction efficiency, %
Source Material
- US EPA Evaluation of Air Pollutant Emissions from Subsonic Commercial Jet Aircraft-April 1999
- EPA Emissions Factors and Policy Applications Center (EFPAC)
Links
- Internal Civil Aviation Organization Studies
- Special Report on Aviation and Global Atmosphere
- NASA- study on Aircraft emissions and Air Quality Degradation
- ARGONNE NATIONAL LAB- Impact of aircraft emissions on air Quality
- UN Aviation Agency Actions to combat Aircraft Emissions
- UK's National Aircraft Emissions Inventory studies
- Nature Journal of Science- Aircraft emissions dabates
- Environmental Studies Associates
References & Further reading
- http://www.faa.gov/regulations_policies/policy_guidance/envir_policy/media/aeprimer.pdf
- http://www.atag.org/files/FAST%20FACTS-120341A.pdf
- http://www.iata.org
- U.S. Department of Transportation, Bureau of Transportation Statistics, Transportation Indicators
http://www.bts.gov/publications/transportation_indicators/december_2002/ , December 2002.
- U.S. Department of Transportation, Federal Aviation Administration, FAA Long-Range Aerospace
Forecasts Fiscal Years 2015, 2020 and 2025, Office of Aviation Policy and Plans, FAA-APO-00-5,
http://apo.faa.gov/lng00/lng00.pdf, June 2000.
- GDP - U.S. Department of Commerce, Bureau of Economic Analysis, National Accounts Data
http://www.bea.gov/bea/dn1.htm; RTM - U.S. Department of Transportation, Bureau of Transportation
Statistics, Historical Air Traffic Statistics, http://www.bts.gov/oai/indicators/airtraffic/annual/1981-
2001.html; VMT – U. S. Department of Transportation, Federal Highway Administration, Traffic Volume
Trends, December 2002 http://www.fhwa.dot.gov/ohim/tvtw/02dectvt/tvtdec02.pdf.
- Wickrama, Upali, International Civil Aviation Organization, Committee on Environmental Protection,
Forecasting and Economic Analysis Support Group, Report of the FESG/CAEP/6 Traffic and Fleet
Forecast, copy of Figure 8, 2003 op. cit. - U.S. Environmental Protection Agency, National Air Quality 2001 Status and Trends,
http://www.epa.gov/airtrends/aqtrnd01/, September 2002.
[http://www.epa.gov/air/airtrends/aqtrnd03/fr_table.html]
- Waitz, I. A., Massachusetts Institute of Technology, private communication based on Boeing data,
November 2003.
- U.S. Environmental Protection Agency, Average Annual Emissions, All Criteria Pollutants; Years
Including 1980, 1985, 1989-2001, http://www.epa.gov/ttnchie1/trends/index.html, February 2003.
- Clean Air Act Amendments of 1990, Title I – Provisions for Attainment and Maintenance of National
Ambient Air Quality Standards, Section 101(d)(1), November 15, 1990.
- U.S. Environmental Protection Agency, 8-Hour Ground-level Ozone Designations,
http://www.epa.gov/ozonedesignations/statedesig.htm, May 6, 2004.
- U.S. Department of Transportation, Federal Aviation Administration, Enplanement Activity at Primary
Airports, http://www.faa.gov/arp/planning/stats/2002/CY02CommSerBoard.pdf , November 6, 2003.
- U.S. Environmental Protection Agency, Classifications of Ozone Nonattainment Areas, op.cit.
- U.S. Department of Transportation, Federal Aviation Administration, Federal Highway Administration
(cooperating agency), Final Environmental Impact Statement for 9,000-Foot Fifth Runway and Associated
Projects: Hartsfield Atlanta International Airport, August 2001.
18
Illinois Environmental Protection Agency, Illinois 1999 Periodic Emissions Inventory And Milestone
Demonstration, December, 2001. The higher value for in the area inventory data in the table is for a typical
summer day, which is the ozone season and probably represents a worst case since it is the most active
period for aviation activity. The non-road data also is based on typical summer day. The lower value, which
is more representative for an annual value is from U.S. Department of Transportation, Federal Aviation
Administration, Final Environmental Assessment for the World Gateway Program and Other Capital
Improvements: Chicago O’Hare International Airport, Chicago, Illinois, June 21, 2002.
- South Coast Air Quality Management District, Emissions by Category, 2001 Estimated Annual Average
Emissions, South Coast Air Basin.
http://www.arb.ca.gov/app/emsinv/emssumcat_query.php?F_DIV=0&F_YR=2001&F_AREA=AB&F_AB =SC , 2001.
- Texas Natural Resource Conservation Commission, Dallas/Fort Worth Ozone Nonattainment Area
Emission Data, http://www.tnrcc.state.tx.us/air/aqp/ei/rsumdfw.htm, 1996 inventory data. Data includes all
airports in the nonattainment area including, DFW International Airport, Dallas Love Field, and Alliance
Airport. - U.S. Department of Transportation, Federal Aviation Administration, Final Environmental Impact
Statement Runway 8L-26R and Associated Near-Term Master Plan Projects; George Bush Intercontinental
Airport/Houston, July 2000. - Compilation of data from the SIP inventories for New York and New Jersey provided by Mr. Raymond
Forde, Region 2, U. S. Environmental Protection Agency, June 16, 2004. Additional data provided by Mr.
Kevin McGarry, New York State Department of Conservation and Ms. Tonalee Key, New Jersey
Department of Environmental Protection. - Agyei, Kwame, Puget Sound Clean Air Agency, airport emissions calculated using EDMS 4.0; area non-
road and total emissions from 1999 Air Emission Inventory Summary spreadsheet, February 11, 2003. - Nonattainment area non-road and total NOx emissions, 68 FR 25431, May 12, 2003; Airport emissions
escalated from 1995 estimate by URS Greiner, Inc. (1997) based on 2000 data provided by Tony Petruska, U.S. EPA. - Massachusetts Department of Environmental Protection, Massachusetts Periodic Emissions Inventories
1999, April 2003, for nonattainment area off-road emissions and total emissions, which are based on
summer day emissions. U.S. Department of Transportation, Federal Aviation Administration, Final
Environmental Impact Statement, Logan Airside Improvements Planning Projects: Boston Logan
International Airport, June 2002 for Logan Airport emissions, which are typical for an annual value. - U.S. Environmental Protection Agency, National Air Pollutant Emission Trends, 1990-1998,
http://www.epa.gov/ttn/chief/trends/trends98/index.html, March 2000.
- For NOx, aircraft represent anywhere from 60 to 80 percent of total airport emissions with the balance
coming from the other sources like ground support equipment and ground access vehicles. This is based on
a review of recent Environmental Impact Statements for eleven airports (ATL, BOS, CLE, DFW, IAD,
IAH, LAX, ORD, PTI, SFO, and STL). - For more information about the production of contrails by aircraft, see U.S. Environmental Protection
Agency, Aircraft Contrails Factsheet, http://www.epa.gov/otaq/regs/nonroad/aviation/contrails.pdf,
September 2000. - U.S. Environmental Protection Agency, Inventory of U.S. Greenhouse Gas Emissions and Sinks: 1990-
2001, http://yosemite.epa.gov/oar/globalwarming.nsf/UniqueKeyLookup/LHOD5MJQ6G/$File/2003-
final-inventory.pdf, April 15, 2003. Estimates are presented in units of terragrams of carbon dioxide
equivalents (Tg CO2 Eq.), which weight each gas (e.g., CO2 and NOx) by its Global Warming Potential, or GWP, value. - U.S. Environmental Protection Agency, Inventory of U.S. Greenhouse Gas Emissions and Sinks: 1990-
2001, 2003 op.cit. - Intergovernmental Panel on Climate Change, Aviation and the Global Atmosphere, 1999.
- Actual Emissions 1990-2001 – U.S. Environmental Protection Agency, Inventory of U.S. Greenhouse
Gas Emissions and Sinks: 1990-2001, 2003 op.cit.
- Forecast Emissions 2001-2025 calculated based on FAA long-range activity forecasts assuming a
constant rate of emissions from aircraft. The forecast is deemed conservative since it does not account for
improvements in aircraft energy efficiency over the next 20 years, which are deemed likely. Estimates are
presented in units of terragrams of carbon dioxide equivalents (Tg CO2 Eq.), which weight each gas (e.g.,
CO2 and NOx) by its Global Warming Potential, or GWP, value.
- U.S. Department of Energy, Oak Ridge National Laboratory, Transportation Energy Data Book: Edition
22, http://www-cta.ornl.gov/data/tedb22/Full_Doc_TEDB22.pdf, September 2002.
- US Department of Transportation, Bureau of Transportation Statistics, National Transportation Statistics
2002 (BTS 02-08), Table 4-20: Energy Intensity of Passenger Modes (Btu per passenger-mile), page 281,
http://www.bts.gov/publications/national_transportation_statistics/2002/pdf/entire.pdf.
- See FAR Part 33 – Airworthiness Standards: Aircraft Engines
http://www.airweb.faa.gov/Regulatory_and_Guidance_Library/rgFAR.nsf/CurrentFARPart?OpenView&St art=1&Count=200&Expand=10.
- Colpin, J. and Altman, R., Dependable Power Reinvented, AIAA 2003-2882, AIAA-ICAS International
Air and Space Symposium and Exhibit: The Next 100 Years, July 14-17, 2003, Dayton, OH.
- The use of market-based options for limiting or reducing greenhouse gas emissions from aviation may
also prove potentially useful applied to local air quality emissions.
- Air Transport World, United says cutting APU runtime to save $12 million, ATW Online.com, February
10, 2003.
- International Civil Aviation Organization, Circular 303 - Operational Opportunities to Minimize Fuel
Use & Reduce Emissions, February 2004.
Aviation & Emissions – A Primer
- U.S. Department of Transportation, Federal Aviation Administration, National Airspace System
Operational Evolution Plan, December 2002
- U.S. Department of Transportation, Federal Aviation Administration, Final Regulatory Impact Analysis,
Final Regulatory Flexibility Determination, Unfunded Mandates and Trade Impact Assessment, Reduced
Vertical Separation Minimum Operations in United States Domestic Airspace, March 10, 2003
- Drew, P., et al., Technology Drivers for 21st Century Transportation Systems,” AIAA 2003-2909, AIAA-
ICAS International Air and Space Symposium and Exhibit: The Next 100 Years,” 14-17 July 2003,
Dayton, OH
- Waitz, I. A., Massachusetts Institute of Technology, Aircraft, Gas Turbine Engines and Emissions
Primer, August 3, 2001.
- Intergovernmental Panel on Climate Change, 1999 op.cit.
- ICAO has established a Long-Term Technology Goals (LTTG) task group within Working Group 3 to
monitor and track future aircraft technologies that may demonstrate better environmental performance. The
LTTG will evaluate the prospects for setting emissions goals as targets for future technology performance.
- National Aeronautics and Space Administration, NASA Aerospace Technology Enterprise Strategy –
2003, http://www.aerospace.nasa.gov/strat_plan2003_low.pdf.
- More information on the FAA-NASA Center of Excellence for Aircraft Noise and Aviation Emissions
Mitigation can be found at http://web.mit.edu/aeroastro/www/partner/.
- Waitz, I. A., Massachusetts Institute of Technology, 2001 op. cit., estimates “22 to 37 years total time
from basic technology (e.g. NASA research) to significant fleet impact.”
- National Research Council, Division on Engineering and Physical Sciences, Aeronautics and Space
Engineering Board, Committee on Aeronautics Research and Technology for Environmental Compatibility,
For Greener Skies: Reducing Environmental Impacts of Aviation, available at
http://bob.nap.edu/html/greener_skies/notice.html, 2002.
Noise Abatement
According to the NRDC's 1997 study, "In adapting a threshold of 65 dbDNL, FAA rejected EPA's health based recommendations and chose, instead, to balance the protection of public health and welfare with competing economic and technological considerations".
The FAA's Noise Abatement guidelines push the implementation of such rules in to the hands of the air traffic controllers and the pilots. The responsibilty of noise abatement is then shared between the airports, airlines, local and regional government, and citizen of the communites effected.
The FAA asks local governement to form "Noise Response Process" to address incidents where noise levels become intolerable. So, for example, if you are a resident of a community who is under a flight path, the FAA then makes it YOUR responsibility to call a local hotline, lodge a noise complaint with visual sighting of said aircrafts' tail number. The airport then has the responsibility of then contacting the aircraft carriers owner and levying a fine against them for violating the noise abatement procedures.
If a copious amount of calls are made then, in theory, the air traffic controllers will be more apt to redirect flights away from the 'problem' area.
The flaw in this program is that pilots are now encouraged to utilize parks and open spaces which will suffer from the increased air quality degradation, and the newly impacted areas will suffer the same resonsibility of having to report noise until sufficiently heard and then moved to the next community.
FAA documents:
- Noise Control Act of 1972
- An issue paper may be needed to addresses
compliance with Noise Control Act of 1972 and FAA Order 1050.1D, which are
in addition to Part 36 noise requirements. - Part 36 noise requirements for
foreign certified aircraft An issue paper may be needed to address compliance with Part 36 noise requirements for validation projects from certain countries.
- An issue paper may be needed to addresses
Further Reading on Aircraft Noise
- Federally Funded Noise Abatement Program defunded in the 1970's
- New Jersey Institute of Technology Impact Analysis (For Design Phase FAA)
- FAA's Noise Abatement guidelines for Helicopter aircraft
- WorldWide Fund for Nature International Mark Barrett Studies
- 2000 Letter to DOT Regarding Noise Abatement procedures
Fuel Jettison over land
Risk analysis studies need to be executed and delivered to area at risk for Fuel Jettison over land. In the new NAR, the land is a preferrable route to the sea where Fuel Jettison Risk was mitigated.
- Studies over water
- Biological And Health Effects Of Exposure To Kerosene-Based Jet Fuels And Performance Additives Glenn Ritchie a; Kenneth Still b; John Rossi III b; Marni Bekkedal b; Andrew Bobb b; Darryl Arfsten; Geo-Centers, Inc., Wright-Patterson Air Force Base; Naval Health Research Center Detachment-Toxicology, Wright-Patterson Air Force Base
DOI: 10.1080/10937400306473
Published in: Journal of Toxicology and Environmental Health, Part B, Volume 6, Issue 4 July 2003, pages 357 - 451
- FAA Regulations & Policies
- Transportation research board studies on impacts of Aviation Jet engine emissions on flaora and Fauna.
- Impact to Flora Fauna find latest Studies on Flora Fauna through Google Scholar
- Center of Atmospsheric Science Seminars
|
National Academies Study on Aircraft Emissions on Wetlands Evaluating Particulate Emissions from Jet Engines: Analysis of Chemical and Physical Characteristics and Potential Impacts on Coastal Environments and Human Health Journal Authors Abstract: The results of this study suggest that the range of size of particulate emissions from some jet engines clusters below 1.5 ?m and that the emissions contain heavy metals. Therefore, jet exhaust particulates (JEPs) have the potential to adversely affect both the environment and human health. Little is known about the particulate component of jet engine emissions. Baseline physical and chemical data on JEPs were obtained to evaluate their potential effects on the environment. Particles collected from the exhaust stream of two types of jet engines were examined using scanning electron microscopy. Analysis indicated that 100 percent of the particles collected were below 1.5 ?m in size. Particles in this size range can penetrate to the alveoli of human lungs. Chemical analyses of jet engine exhaust were conducted in an attempt to identify chemical fingerprints that would distinguish aviation emissions in the environment from other anthropogenic emissions. Certain heavy metals, especially vanadium, were found in jet exhaust and may be useful chemical fingerprints. Analysis of JP-5 fuel standards revealed a suite of alkylbenzene hydrocarbons, which may also aid in fingerprinting aviation emissions. Sediment samples taken at coastal wetlands near airports indicated the presence of the same heavy metals as those found in jet exhaust samples. Field sites exposed to higher volumes of air traffic contained higher levels of sediment heavy metals, supporting the hypothesis that aerial deposition of heavy metals is occurring in areas near some airports. |
Global Warming & The Jet Engine
According to the Intergovernmental Panel on Climate Change Aviation Jet emissions directly contribute to global warming(1.):
- Aircraft emit gases and particles directly into the upper
troposphere and lower stratosphere where they have an impact
on atmospheric composition. These gases and particles alter
the concentration of atmospheric greenhouse gases, including
carbon dioxide (CO2), ozone (O3), and methane (CH4); trigger
formation of condensation trails (contrails); and may increase
cirrus cloudiness—all of which contribute to climate change in the stratosphere.
According to an article published Dec 6, 2006 in USA Today, Gary Stoller writes:
Aviation and the environment are on a collision course." The number of airline flights worldwide is growing and expected to skyrocket over the coming decades. Aircraft emissions pollute the air and threaten by 2050 to become one of the largest contributors to global warming, British scientists have concluded.
|
New York Times Article published Jan 7, 1992:
Global Warming Threat Found in Aircraft Fumes |
Links
Studies on Global Warming and Aviation
- NASA/Boeing inventories (Scheduled, Civil, Global) for 1976, 1984, 1992 and 1999 [Baughcuma,b 1996 and Sutkus 2001]
- Aviation and The Global Atmosphere (Columbia University Press) [Intergovernmental Panel on Climate Change 1999]
- ANCAT/EC2 (Civil and Global)inventories for 1991/92 [Gardner 1998]
- DLR (Civil and Global) inventories for 1992 [Schmitt 1997]
- AERO-MS inventories for 1992 [Pulles 2002]
- According to the FAA SAGE was developed by FAA in large part because there was no up-to-date non-proprietary model that could be used to estimate aircraft emissions on a global level. As such, FAA developed SAGE (now at Version 1.5) from the best publicly available data and methods in order to provide the international aviation community with a high-fidelity tool that can be used to analyze various policy, technology, and operational scenarios. So far, SAGE has been used to develop inventories for 2000-2004. The current commitment from FAA is to continue development and validation of SAGE to produce inventories of fuel burn and emissions on a yearly basis.Get the report here
References
- Baughcuma, S.L., T.G. Tritz, S.C. Henderson, and D.C. Pickett. “Scheduled Civil Aircraft EmissionInventories for 1992: Database Development and Analysis.” NASA CR 4700. April 1996.
- Baughcumb, S. L., S. C. Henderson, and T. G. Tritz. “Scheduled Civil Aircraft Emission Inventories for 1976 and 1984: Database Development and Analysis.” NASA CR-4722. 1996.
- Federal Aviation Administration (FAAa). “System for assessing Aviation’s Global Emissions (SAGE), Version 1.5, Technical Manual.” FAA, Office of Environment and Energy. FAA-AEE-2005-01.September 2005.
- Federal Aviation Administration (FAAb). “System for assessing Aviation’s Global Emissions (SAGE),Version 1.5, Validation Assessment, Model Assumptions and Uncertainties.” FAA, Office of
Environment and Energy. FAA-AEE-2005-03. September 2005.
- Gardner, R. “Global Aircraft Emissions Inventories for 1991/92 and 2015, Report by the ECAC/ANCAT and ED Working Group.” Editor: R. M. Gardner. EUR18179. 1998.
- Intergovernmental Panel on Climate Change (IPCC). “Revised 1996 IPCC Guidelines for National Greenhouse Gas Inventories, Reference Manual (Volume 3).” http://www.ipccnggip.
iges.or.jp/public/gl/invs6.htm. 1997.
- Intergovernmental Panel on Climate Change (IPCC). “Aviation and the Global Atmosphere.” A Special Report of IPCC Working Groups I and II. Edited by J.E. Penner, D.H. Lister, D.J. Griggs, D.J. Dokken, and M. McFarland. Cambridge University Press. 1999.
- Pulles, J.W. “Aviation Emissions and Evaluation of Reduction Options (AERO), Main Report.”
Ministry of Transport, Public Works and Watermanagement, Directorate-General of Civil Aviation, the Hague. ISBN 90-369-1792-1. July 2002.
- Schmitt, A., B. Brunner. “Emissions from Aviation and their Development over Time". In Final Report on the BMBF Verbundprogramm, Schadstoff in der Luftfahrt. DLR-Mitteilung 97-04, Deutches Centrum Fuer Luft- and Raumfahrt. 1997.
- Sutkus Jr., Donald J., Steven L. Baughcum, and Douglas P. DuBois. “Scheduled Civil Aircraft Emission Inventories for 1999: Database Development and Analysis.” National Aeronatics and Space Administration (NASA) Glenn Research Center, Contract NAS1-20341. NASA/CR-2001-211216. October 2001.
- United Nations Environment Programme (UNEP)/World Meteorological Organization (WMO). Article 4 of the Framework Convention on Climate Change published by the UNEP/WMO Information Unit on Climate Change (also identified in Article 12). See <http://unfccc.int>. 2000.
Intergovernmental Panel on Climate Change Aviation and Global Warming
The Australian government has commissioned severeal environmental studies on health, social, environmental, mental impacts to aircraft noise, emissions and vibrations. Based on these finding, they have adopted legislation which specifically protects the airline industry from full control of airspace.
Below is an excerpt from their findings which has been incorporated into Australian law.
|
HARMONIC VIBRATION IMPACTS FROM AIRCRAFT
|
|
Harmonic vibrations can be caused in buildings and in items within buildings by the "Any proposal for airspace change that may lead to a change in the pattern or |
NRDC's report on Pollution effects
Endangered Species Extinction
Australia Governmental impact study Analaysis
References and Further Reading
1. Anderson, C., S. Augustine, Embt, and T. Thrasher, Emission and Dispersion Modeling
System (EDMS) Reference Manual, U.S. Dept. of Trans., Federal Aviation Administration,
Report No. FAA-AEE-97-01, Washington, D.C., April, 1997.
2. U.S. Environmental Protection Agency, MOBILE5a, Office of Mobile Sources, Ann Arbor,
Michigan, February, 1995.
3. International Civil Aviation Organization, Aircraft Engine Exhaust Emissions Databank,
Defence Evaluation and Research Agency,
, last accessed, March, 2001.
4. U.S. Environmental Protection Agency, Compilation of Air Pollution Emission Factors, AP-
42, Fifth Edition, Research Park, N.C., May, 1998.
5. Petersen, W.B. and E.D. Rumsey, User’s Guide for PAL 2.0 - A Gaussian Plume Algorithm
for Point, Area, and Line Sources, Environmental Sciences Research Laboratory, Research
Triangle Park, NC, October, 1986.
6. Benson, P., CALINE3 - A Versatile Dispersion Model for Predicting Air Pollutant Levels
Near Highways and Arterial Streets, Report No. FHWA/CA/TL-79/23, California Dept. of
Transp., Office of Transp. Laboratory, Sacramento, CA., Nov., 1979.
7. Federal Aviation Administration Office of Environment and Energy Home Page.
http://www.aee.faa.gov/aee-100/aee-120/edms/5yrv01.pdf (accessed January, 2001).
8. Cimorelli, A.J., S.G. Perry, A. Venkatram, J.C. Weil, R.J. Paine, R.B. Wilson, R.F. Lee, and W.D. Peters, AERMOD - Description of Model Formulation, Draft, Environmental Protection
Agency, Office of Air Quality Planning and Standards, Research Triangle Park, NC, December,
1998.
9. U.S. Environmental Protection Agency, User’s Guide for the National Nonroad Emissions
Model - Draft Version, Ann Arbor, MI, June 1998.
10. Federal Aviation Administration, Consolidated Operations and Delay Analysis System
(CODAS), http://www.apo.data.faa.gov/ibapps/apo/codas/codasindexnew.html (accessed
January, 2001).
11. Society of Automotive Engineers, Procedures for the Calculation of Airplane Noise in the
Vicinity of Airports, Report No. SAE-AIR-1845, 1998.
12. Guiding, J., J. Olmstead, R. Bryan, L. Mirsky, G. Fleming, J. D’Aprile, P. Gerbi, Integrated
Noise Model (INM) Version 6.0, User’s Guide, U.S. Dept. of Transp., Federal Aviation
Administration, Report No. FAA-AEE-99-03, Washington, D.C., August, 1999.
13. Wayson, R.L., G. G. Fleming, W. L. Eberhard, B. Kim, W. A. Brewer, J. Draper, J. Pehrson, and R. Johnson, 2003: The use of LIDAR to characterize aircraft exhaust plumes, Proceedings, 96th Ann. Meeting of AWMA, San Diego, CA, Air and Waste Management Association.
OurAirspace
www.OurAirspace.org
Contact@OurAirspace.orgHOME | What to do | Legislation | Scientific Studies | Research | Solutions | Contact | About | News | Downloads